![]() When a user start a RES Workspace Manager session. Every action is logged into the Event Log. Administrators can use this log for fine tuning the environment. What I always do is filtering out which steps take a lot of time, and dig into that step to make the login procedure faster and faster. The only thing I always ran into is the Date/Time stamp before an event. Is it the beginning of the ending of the event?
When a user start a RES Workspace Manager session. Every action is logged into the Event Log. Administrators can use this log for fine tuning the environment. What I always do is filtering out which steps take a lot of time, and dig into that step to make the login procedure faster and faster. The only thing I always ran into is the Date/Time stamp before an event. Is it the beginning of the ending of the event?
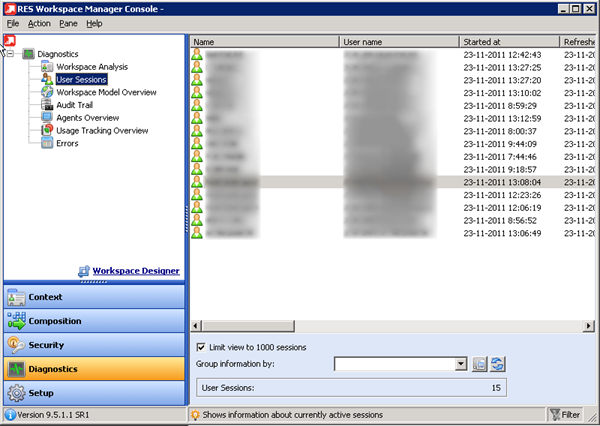
First start the event viewer. This can be done (there are more ways) by clicking on: Diagnostics –> User Sessions –> Double click on the users you want to view.

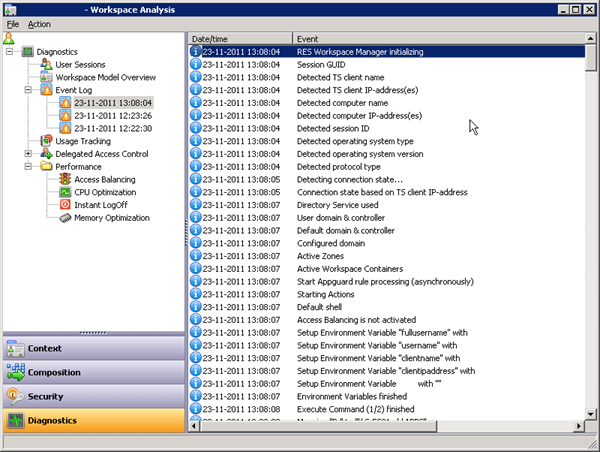
It opens the Workspace Analysis for that specific user. Now browse to: Diagnostics –> Event Log and choose a session.

As you can see in the screenshot. There are a lot of steps (events). In the front there’s the Date/Time. But is it the Start or Ending time?
After digging into this question. I found out that it’s the ending time of that specific event. So the start time is actually the ending time of the previous event.
For instance: 23-11-2011 13:08:05 Detecting connection state…
It’s ended on: 13:08:05 and started on: 13:08:04.
To figure it out yourself. Add a drive mapping to an unknown file share and watch the event log.
Discover more from Jeroen Tielen
Subscribe to get the latest posts sent to your email.
Not to long ago I created a feature request to get a extra column with the duration of each task. Better yet I asked for a possibility to do SNMP trapping when an action takes more time than ” normal” where normal can be defined;).